Everything has a ground floor, a baseline. The baseline drives everything, it functions as the core status quo in which everything is compared to. Without it comparisons would be harder to find. A baseline is nothing more than a defined set of standards that everybody can agree on is acceptable. For the sake of this essay I will define the baseline as the simply the average.
Think of a bell curve, it’s a simple bell shaped graph increasing from right to left until it hits a certain value, then it proceeds to decrease from that value downwards in perfect symmetry.
 A normal distribution, aka a bell curve
Sitting the middle is the average, the baseline in which everything is measured relative to. If you fall on the right side of the baseline you are under performing, if you’re on the left you’re over performing. The x-axis shows the measured value, the y-axis is the frequency. If you’re a runner and you typically run at an average pace of 9 miles those 9 miles sit directly in the middle of the curve. When you have an off day and run 7 miles you’re performing on the right side of the graph, and on days when you have enough stamina to go for a half marathon you’re on the right.
The baseline isn’t static, in fact it moves all the time, a common way that you can move it is by setting goals. A goal is a new baseline you’re trying to reach.

When a goal is set you begin incrementally moving the bell curve towards this new desired baseline. In the case of running let’s say you plan on increasing you average distance to 15 miles. So you begin incrementally growing it, day by day. First you increase your stamina by running ten miles more often, then eleven, then twelve, all the way until you hit your desired average of fifteen. Once it becomes easy for you, you developed a new baseline, a new average in which to measure all things with.
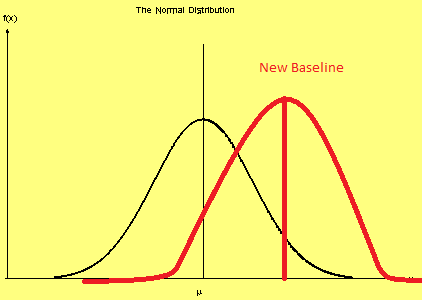 I apologize for the graphic, all I had to work with was MS Paint
However a strange thing happens when you move this baseline. What is not illustrated in these graphics is that everybody has their own baseline, you have your own average, but there are also global averages and community averages. If you push yourself further away from the global average you know you’re doing pretty well, however in that case you will end up entering a new tier, a new community in which you are compared to.
When running you used to be compared to the 10k runners a lot, there you were a top dog running three more miles compared to them, but you were below average for the half marathon runners. Well now you’ve hit fifteen miles, you’re doing roughly two more miles than the half marathoners out there, you’re looking pretty good, but yet fifteen miles is now eleven miles shorter than a marathon. On average you’re better than the global average of all runners, you’re better than the community averages in the 10k and half marathon communities, but your still far behind the averages of the marathon runners.
It can be easy to get blinded by the fact that you’re not doing your best when compared to the marathon runners, pride is a powerful emotion, but that’s fine. What matters is that you moved the baseline and that you’re already outperforming your old baseline. It could be hard to accept that you’re not there yet, but don’t let that hold you back, you’ve already increased your baseline once before, you can do it again. After all, progress is progress.
Day 18
Word Count: 595
Cost per Post: $8.66